
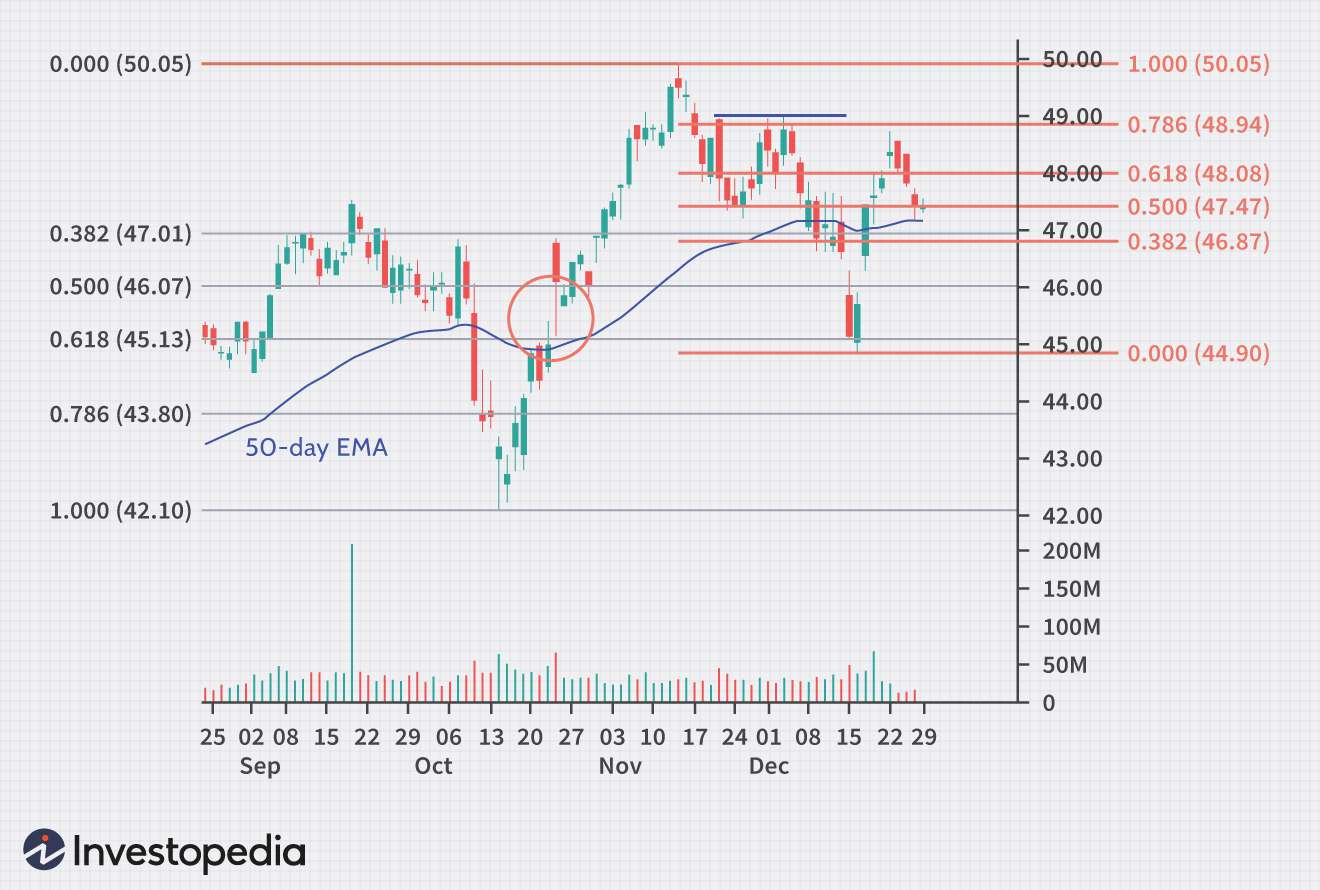
Chasing a runaway market is one of the quickest ways to damage your trading balance. When a strong trend takes off, the emotional urge to jump in immediately often forces you into a poorly timed entry right before a counter-move begins. Utilizing mathematical pulling points like Fibonacci tools helps you sit back patiently and identify reliable zones where a trend is highly likely to resume.
What exactly are Fibonacci retracements, and why do charts care about them?
Fibonacci retracements are horizontal lines drawn across a chart to highlight potential support and resistance areas. These percentages—primarily 38.2%, 50%, and 61.8%—derive from a mathematical sequence found throughout nature. While the market isn’t a physical living organism, millions of automated trading algorithms and retail participants watch these exact geometric levels simultaneously.
Think of a strong market trend like a runner pacing through a long marathon. A runner cannot sprint at maximum speed forever without stopping to catch their breath or take a quick drink of water. Price action moves the same way, building a major swing and then pulling back temporarily to accumulate new orders. When you plot these mathematical boundaries on a high-performance platform from a top-tier best forex broker for mt5, you are simply mapping out the most logical rest stops where buyers are waiting to jump back in.
How do I actually draw these levels on my chart without messing up?
Getting your anchor points right is the most critical part of setting up the tool accurately. To map out an uptrend, click on the absolute lowest point of the move, known as the swing low, and drag your cursor up to the peak, or the swing high. For a downtrend, you reverse the exact process by pulling from the absolute peak down to the floor of the move.
Always ensure you include the candle wicks rather than just anchoring to the candle bodies. Those thin wicks represent real price rejection and extreme liquidity pools that the market tested. If your lines look cluttered or erratic, look to clean up your workspace by removing minor percentages and focusing strictly on the core ratios where major institutional blocks tend to place their pending limit orders.
Which Fibonacci percentage is the most reliable for sourcing an entry?
Every level tells a completely different story about the underlying strength of the current trend. The 38.2% level represents a shallow pullback, indicating that the buyers are incredibly aggressive and won’t let the price drop very far before absorbing supply.
The 50% and 61.8% marks represent the golden discount zone where intermediate pullbacks typically mature. Getting an execution at the 61.8% line gives you an exceptional risk-to-reward setup because your technical invalidation level sits just below the structural start of the move. If you are developing your baseline skills and building out viable forex trading strategies for beginners, prioritizing these deeper structural discounts prevents you from overpaying for entries during volatile sessions.
What happens if the price just slices straight through my Fibonacci levels?
A common mistake is treating these mathematical lines like brick walls that price must respect. They are not absolute barriers; they are simply fluid areas of high interest. If a major macroeconomic news event breaks or liquidity dries up, the price will slice through a 61.8% level without showing any hesitation.
When a level fails to hold, it simply means the short-term market dynamics have shifted or the broader trend is losing its structural integrity. Blindly buying the moment a candle touches a line is a recipe for heavy drawdowns. You must look for secondary confirmation, such as a bullish rejection candlestick or an increase in buying volume, to prove that market participants are actively defending that mathematical zone before risking your capital.
Can I combine Fibonacci tools with other indicators to increase my accuracy?
Relying on a single tool in isolation is rarely enough to build a stable mechanical edge over hundreds of trades. The real magic happens when your Fibonacci levels overlap perfectly with other independent technical elements, a concept known as confluence.
Look for situations where a 50% retracement line aligns perfectly with a historical horizontal support level or a major moving average. When multiple independent trading groups—the trend followers, the support buyers, and the Fibonacci purists—all see their favorite signals flashing at the exact same price point, they will all place orders simultaneously. This concentrated cluster of buying or selling power creates a highly reliable launchpad, keeping your execution clean and protecting your account from unexpected market fakeouts.
Practical Takeaway
Open up your historical charts and practice drawing Fibonacci grids across the last ten major trends on a daily or four-hour time frame. Instead of entering trades using impulsive market orders when prices are stretching higher, practice setting patient buy-limit orders inside the 50% to 61.8% discount window. By ensuring your entries always align with structural confluence zones and keeping your risk parameters anchored safely below the swing low, you turn mathematical pullbacks into a consistent tactical advantage.